Leave a comment at the end of this page or email contact@krishagni.com
Summary reports (Pivot table)
OpenSpecimen query interface allows users to create count based summary reports (i.e. pivot table based reports). E.g.
- Monthly collection summary per collection protocol of count of specimens collected by specimen type.
- Count of specimens by specimen type and disease
- Count of participants by ethnicity and race
Note:
Non-Super Admins cannot run Pivot Tables containing PHI fields.
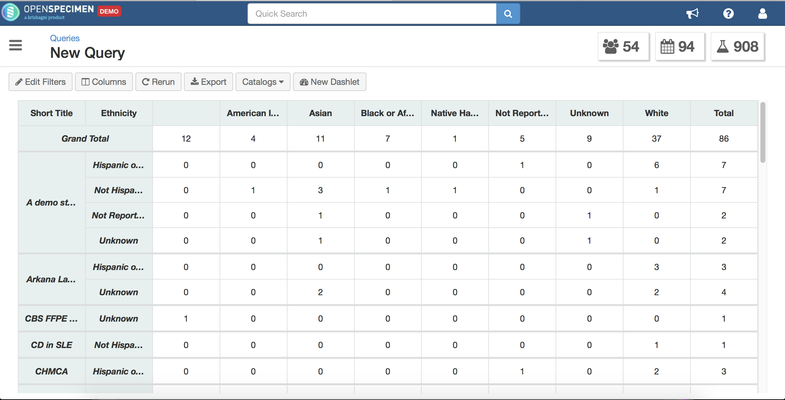
Example: Count of participants by race and ethnicity per protocol
Download Query Definition (JSON)
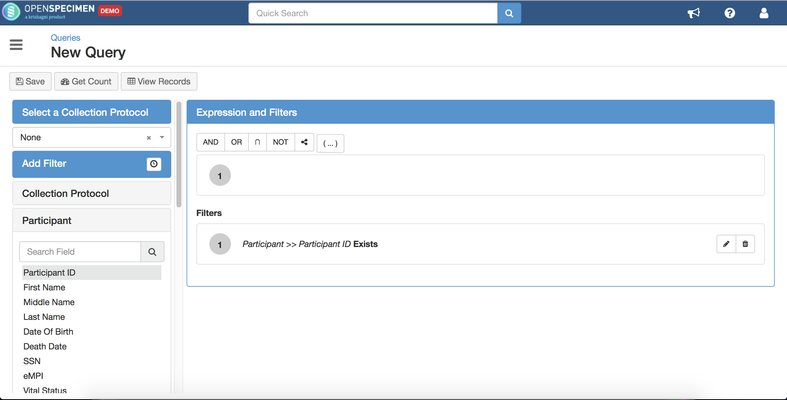
Step 1: Create the query with filters as per needs. If the query should return all participants, you can use 'Participant Id Exists' as shown below:
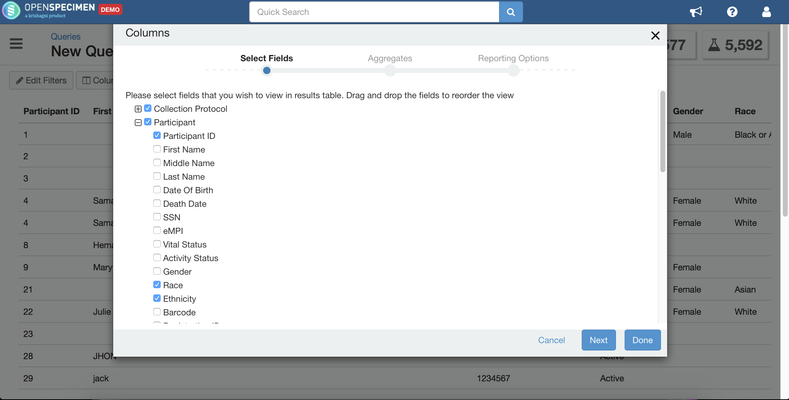
Step 2: Click on 'View Records. From the results view, click on 'Columns' and select the columns required in the report.
Note: Since you need count of participants, you will need to include a field which is unique to all participants like 'Participant ID' or 'eMPI'
In the example above, columns selected are 'Collection Protocol→ Short title', 'Participant → Participant ID, Race, Ethnicity'.
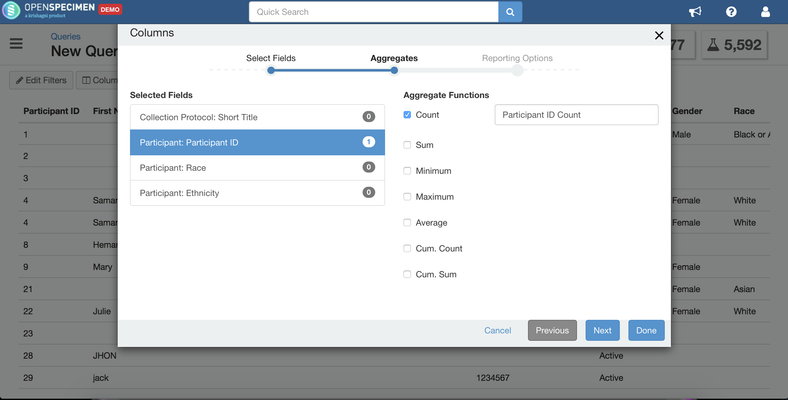
Step 3: Click on 'Next'. Select the field based on which the count should be calculated.
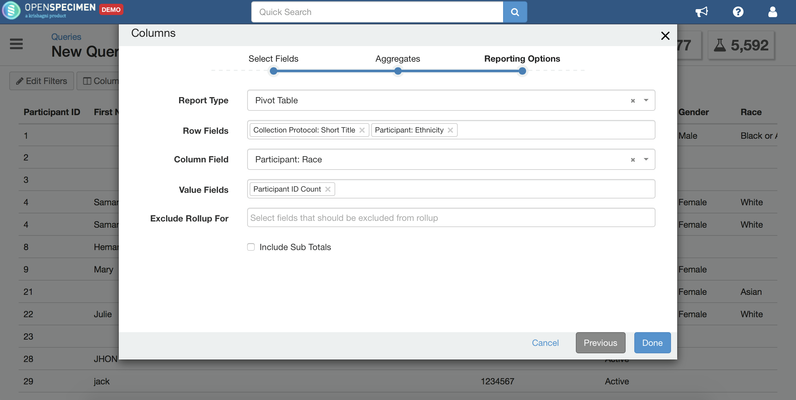
Step 4: Select the report type 'Pivot table' and set the required rows and columns.
Step 5: Click 'Done' to view the report.
Step 6: Save this report for future use or sharing with other users.
Related content
Leave a comment at the end of this page or email contact@krishagni.com
