Leave a comment at the end of this page or email contact@krishagni.com
Dashboard changes using query
- Poornima Govindrao
- Devaki Thaker
- Shraddha Ranpise (Deactivated)
Note
Dashboards are ONLY available in the Enterprise Edition version.
Introduction
The dashboard is an enterprise plugin available to display different metrics and graphs per protocol within OpenSpecimen. A default dashboard is installed for every protocol and can be further customized as per local needs.
Features
- Default dashboard when the plugin is deployed
- Configure different dashboard view per protocol
- The dashboard can contain metrics and graphs
- Dashboard items (known as dashlets) creation using query interface
- Dashlets can be previewed before finalizing (new in v6.3)
Create dashlets
New dashlets can be created using REST API or query interface. There are two types of dashlets:
- Metrics: I.e. just show a numeric counter. E.g. number of participants, number of males, etc.
- Charts
Metrics dashlet
Below steps define how to create a new dashlet for new counter or metrics:
- Go to queries and create the query for the new dashlet. For example, Count of stored aliquots
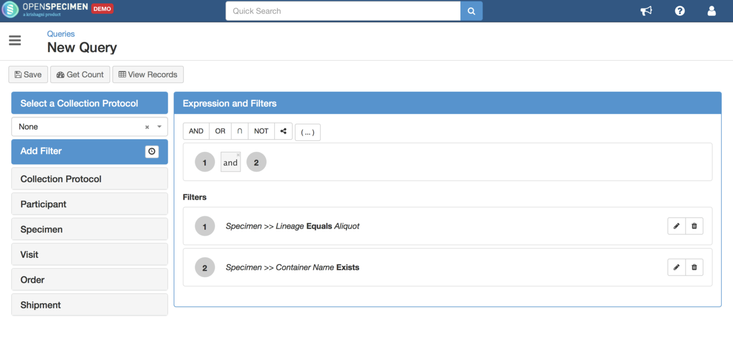
- Click on 'Actions' and click on 'Columns'. Select the 'Specimen Label' column and click on 'Next'. Select the label field and select 'Count' aggregate function.
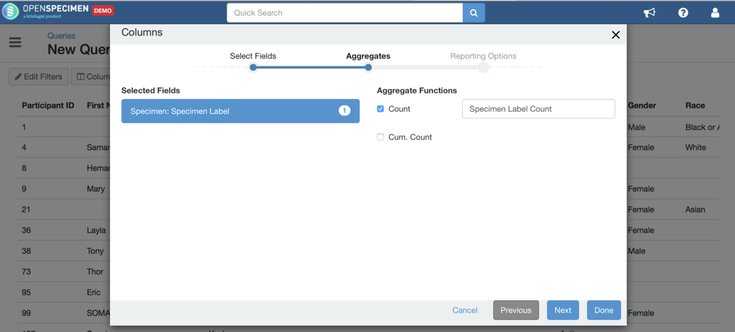
- Click on 'Done' and click on 'New Dashlet'
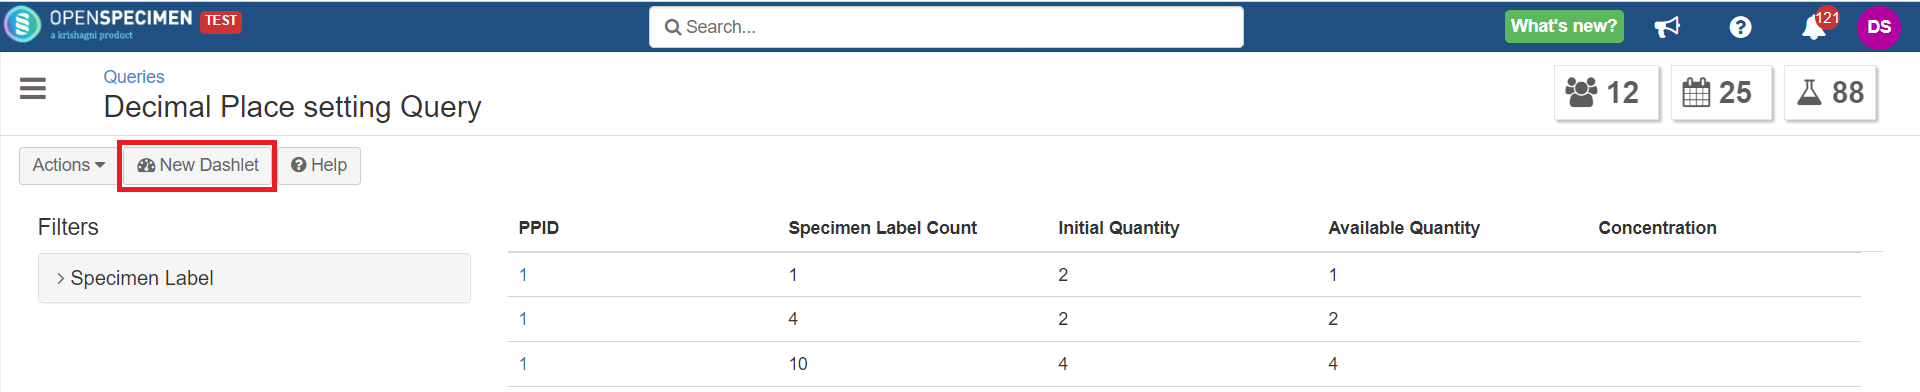
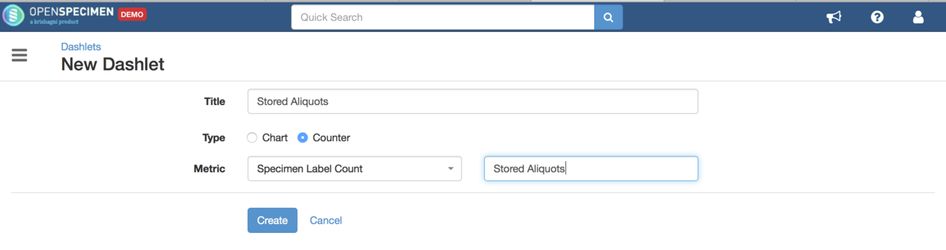
A new dashlet is now created for the count of stored aliquots. This can now be set for the specific protocol to be displayed as part of the protocol. Refer to steps below to set it for a protocol.
Graph dashlet
Dashlets can also be different graphs like bar, pie, line etc. representing different summary data.
Steps to create new graph dashlet, example: count of participants by diagnosis:
- Go to queries and create the query for the new dashlet.
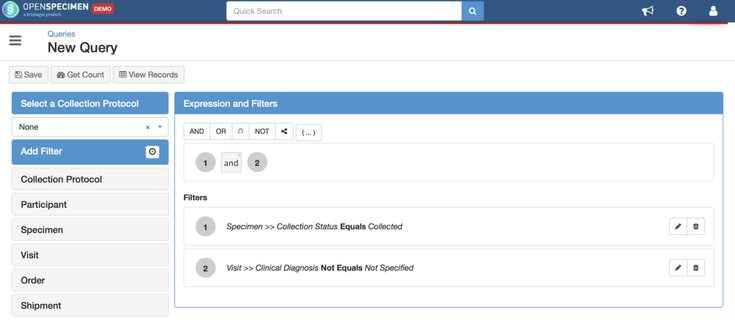
- Click on 'Actions' and click on 'Columns'. Select the 'Participant->Identifier' and 'Visit->Clinical Diagnosis' columns. Click on 'Next'. Select the identifier field and select 'Count' aggregate function.
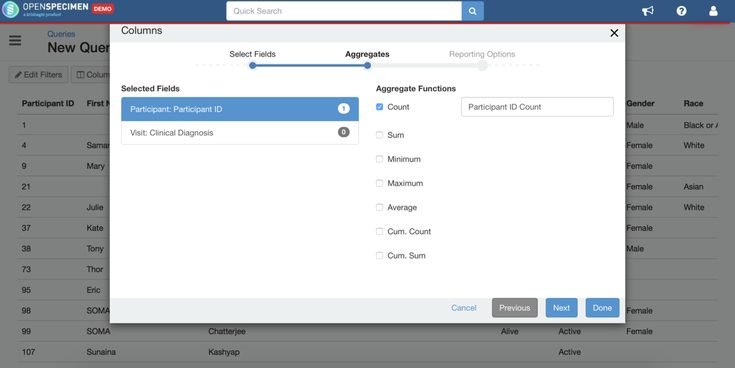
- Click on 'Done' and click on 'New Dashlet' and select type as 'Graph' and fill in rest of required information. From v6.1 onwards, it is possible to set the number of values to be displayed in the dashlet. If user wishes to view top 10 values, then add 10 in field 'Top'. To view bottom 10 values, add 10 in bottom
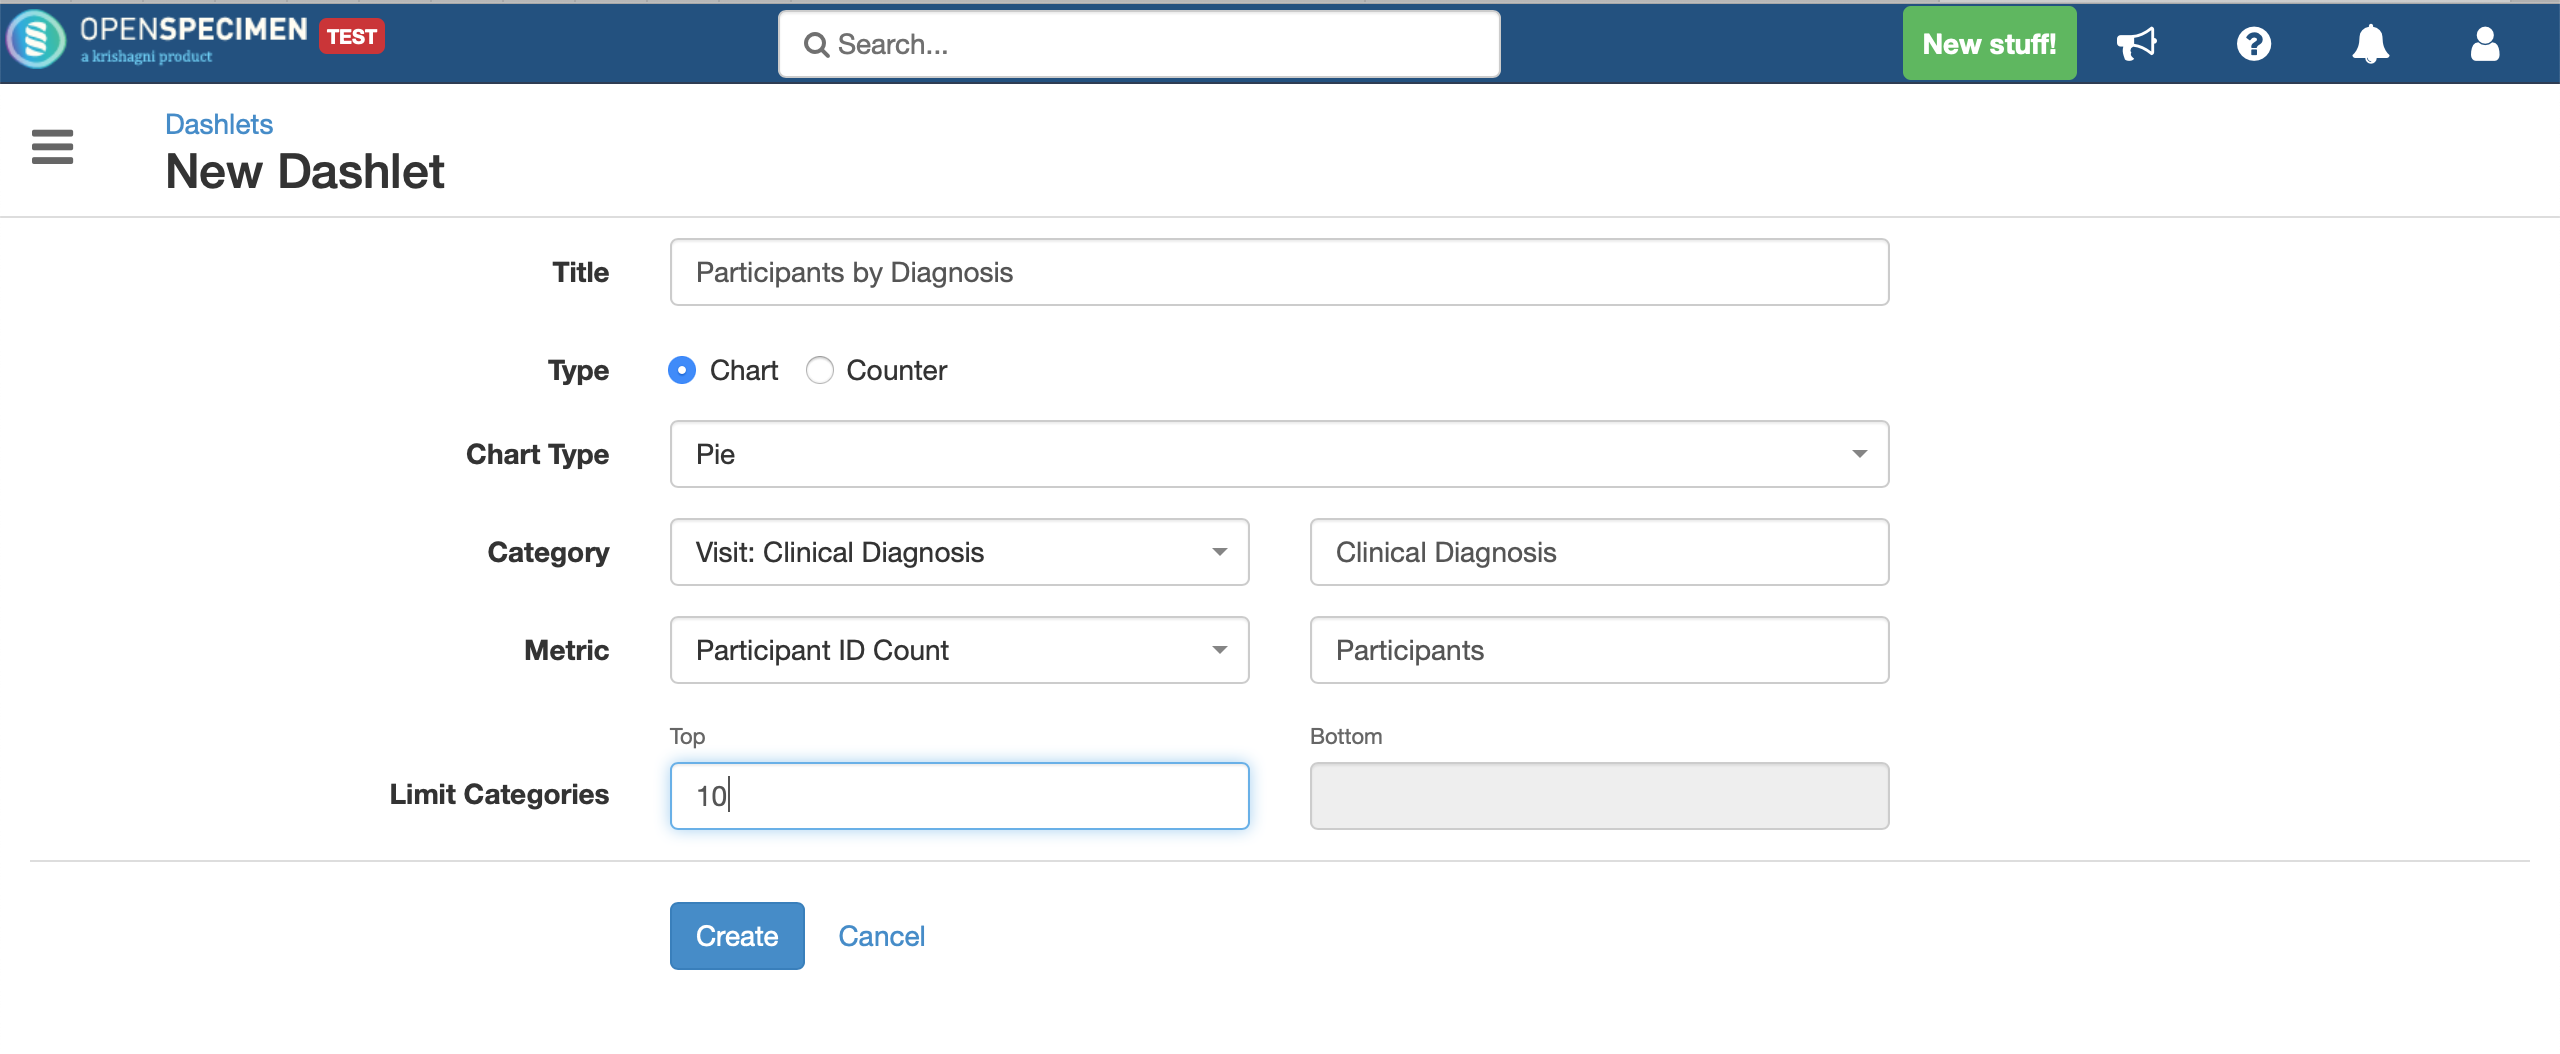
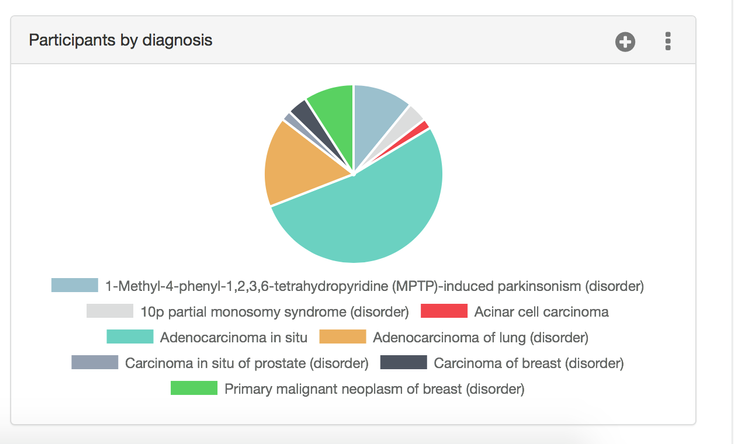
A new dashlet graph is created to display count of participants by diagnosis which can be set for one or more protocols.
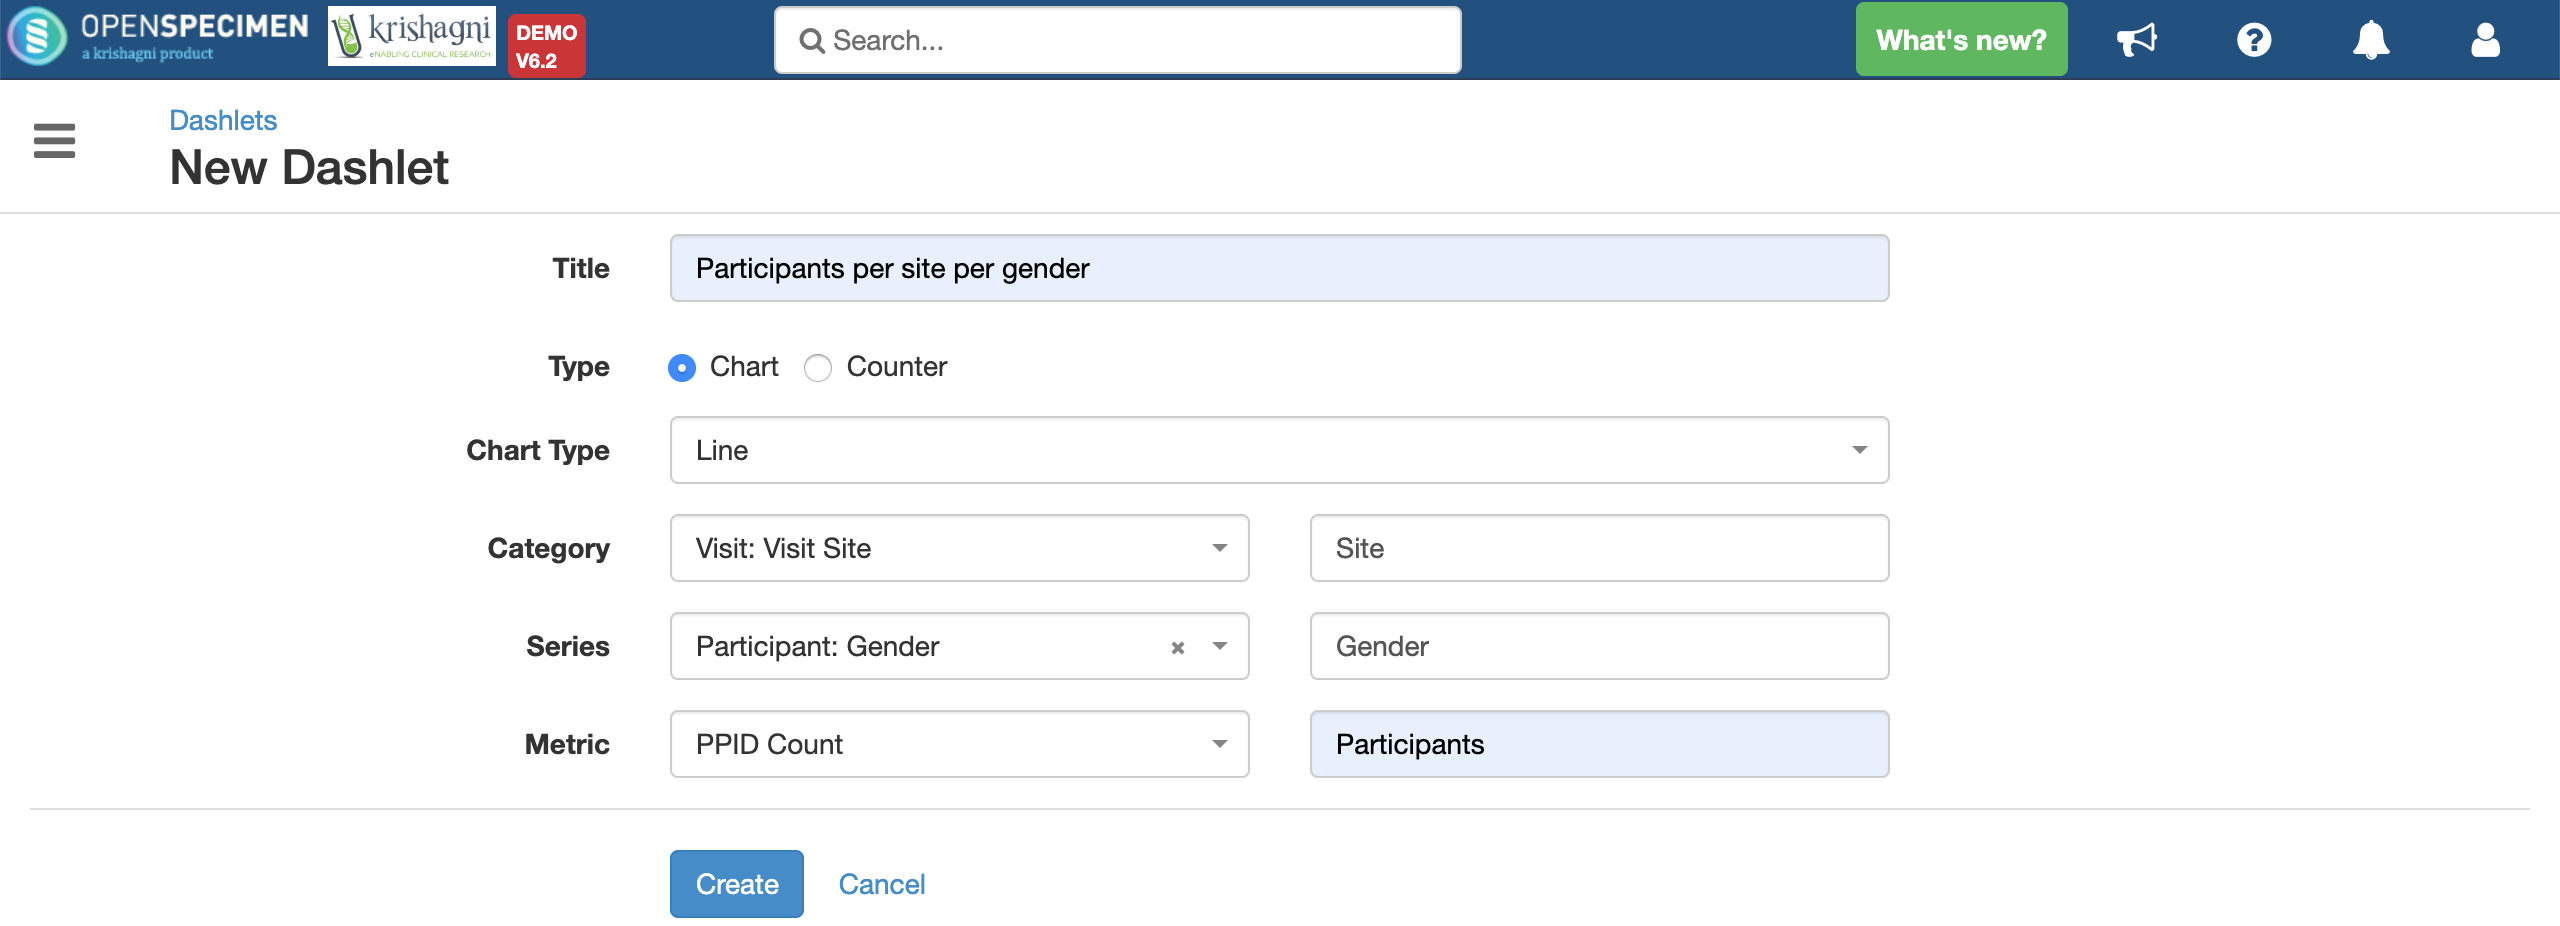
In case of 'Bar', 'Line' and 'Radar' graphs, there are 3 fields that appear. Let us take an example of count of participants per site per gender:
- Category: Specifies the fields that are to be used to categorize the records. The value of X-axis in a graph, and as per the above example, the 'Site' will be 'Category'
- Series: Specifies the value of fields that are to be used to sub-categorize within one specific category. In the above example, since we need a count per site per gender, we will use 'Gender' as the 'Series'. Hence, we will see count for each gender within each site.
- Metric: Specifies the counter value. The value of Y-axis in a graph, and as per the above example, the 'Count of Participants'ID' will be the 'Metric'
So here is how the values will need to be filled:
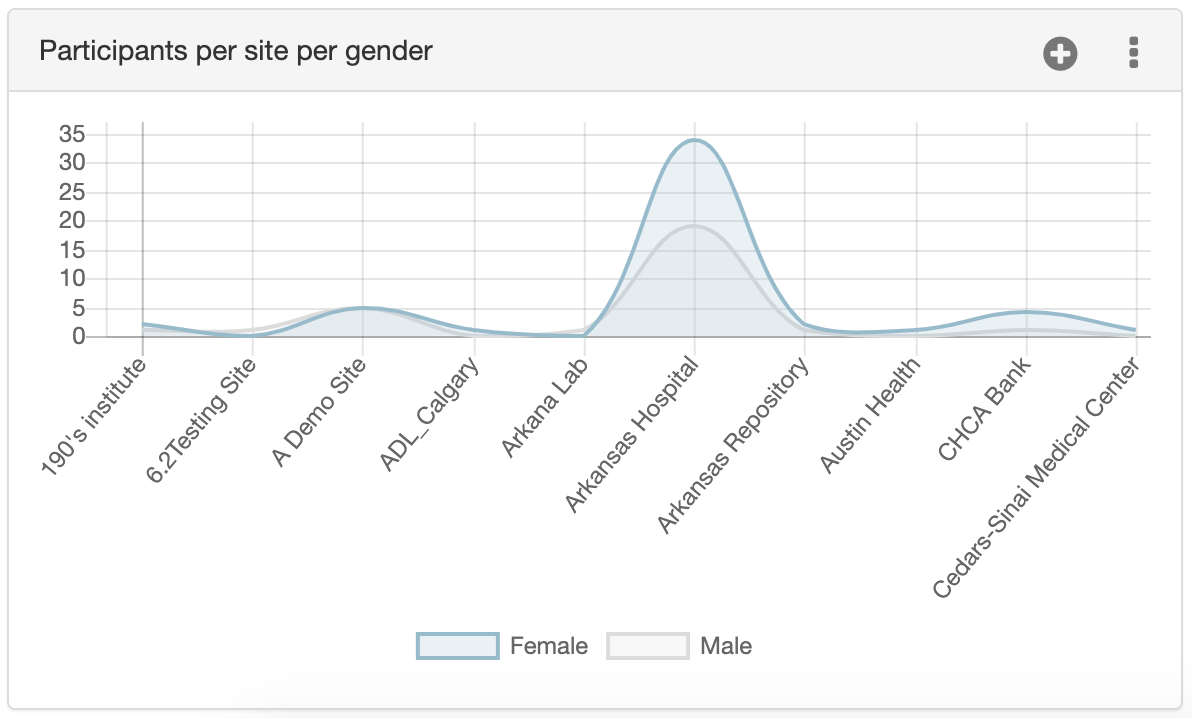
And here is how the graph will look:
Preview dashlet
From v6.3 onwards in OpenSpecimen, it is possible to preview the graph/counter before finalizing it.
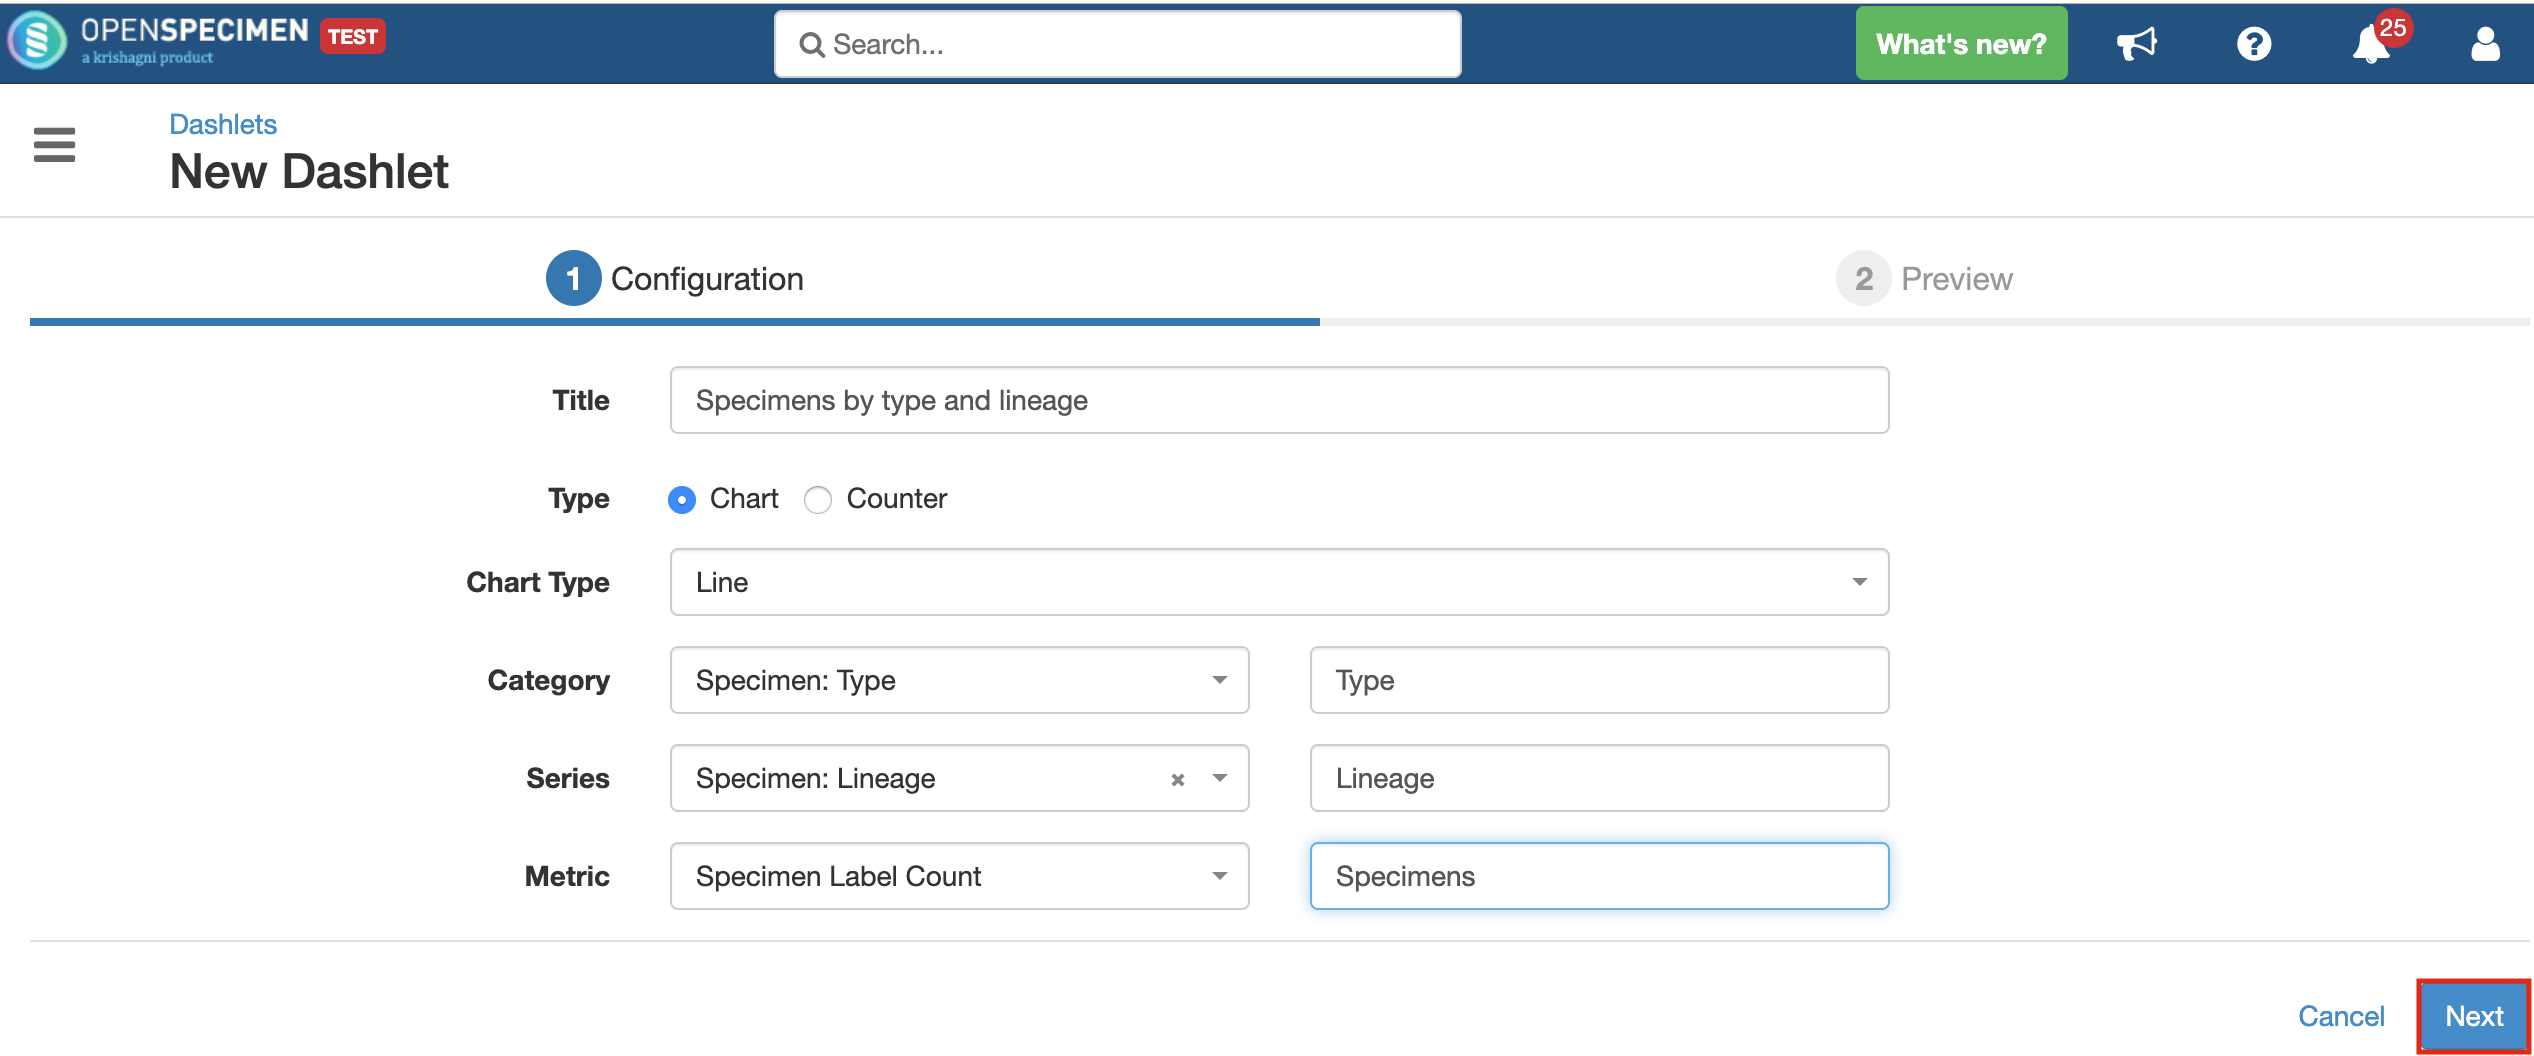
- Clicking on 'New Dashlet' from the query result view page leads to the 'Configuration' page
- Fill in the mandatory details in the 'Configuration' tab and click on 'Next'
- A preview of the chart is shown
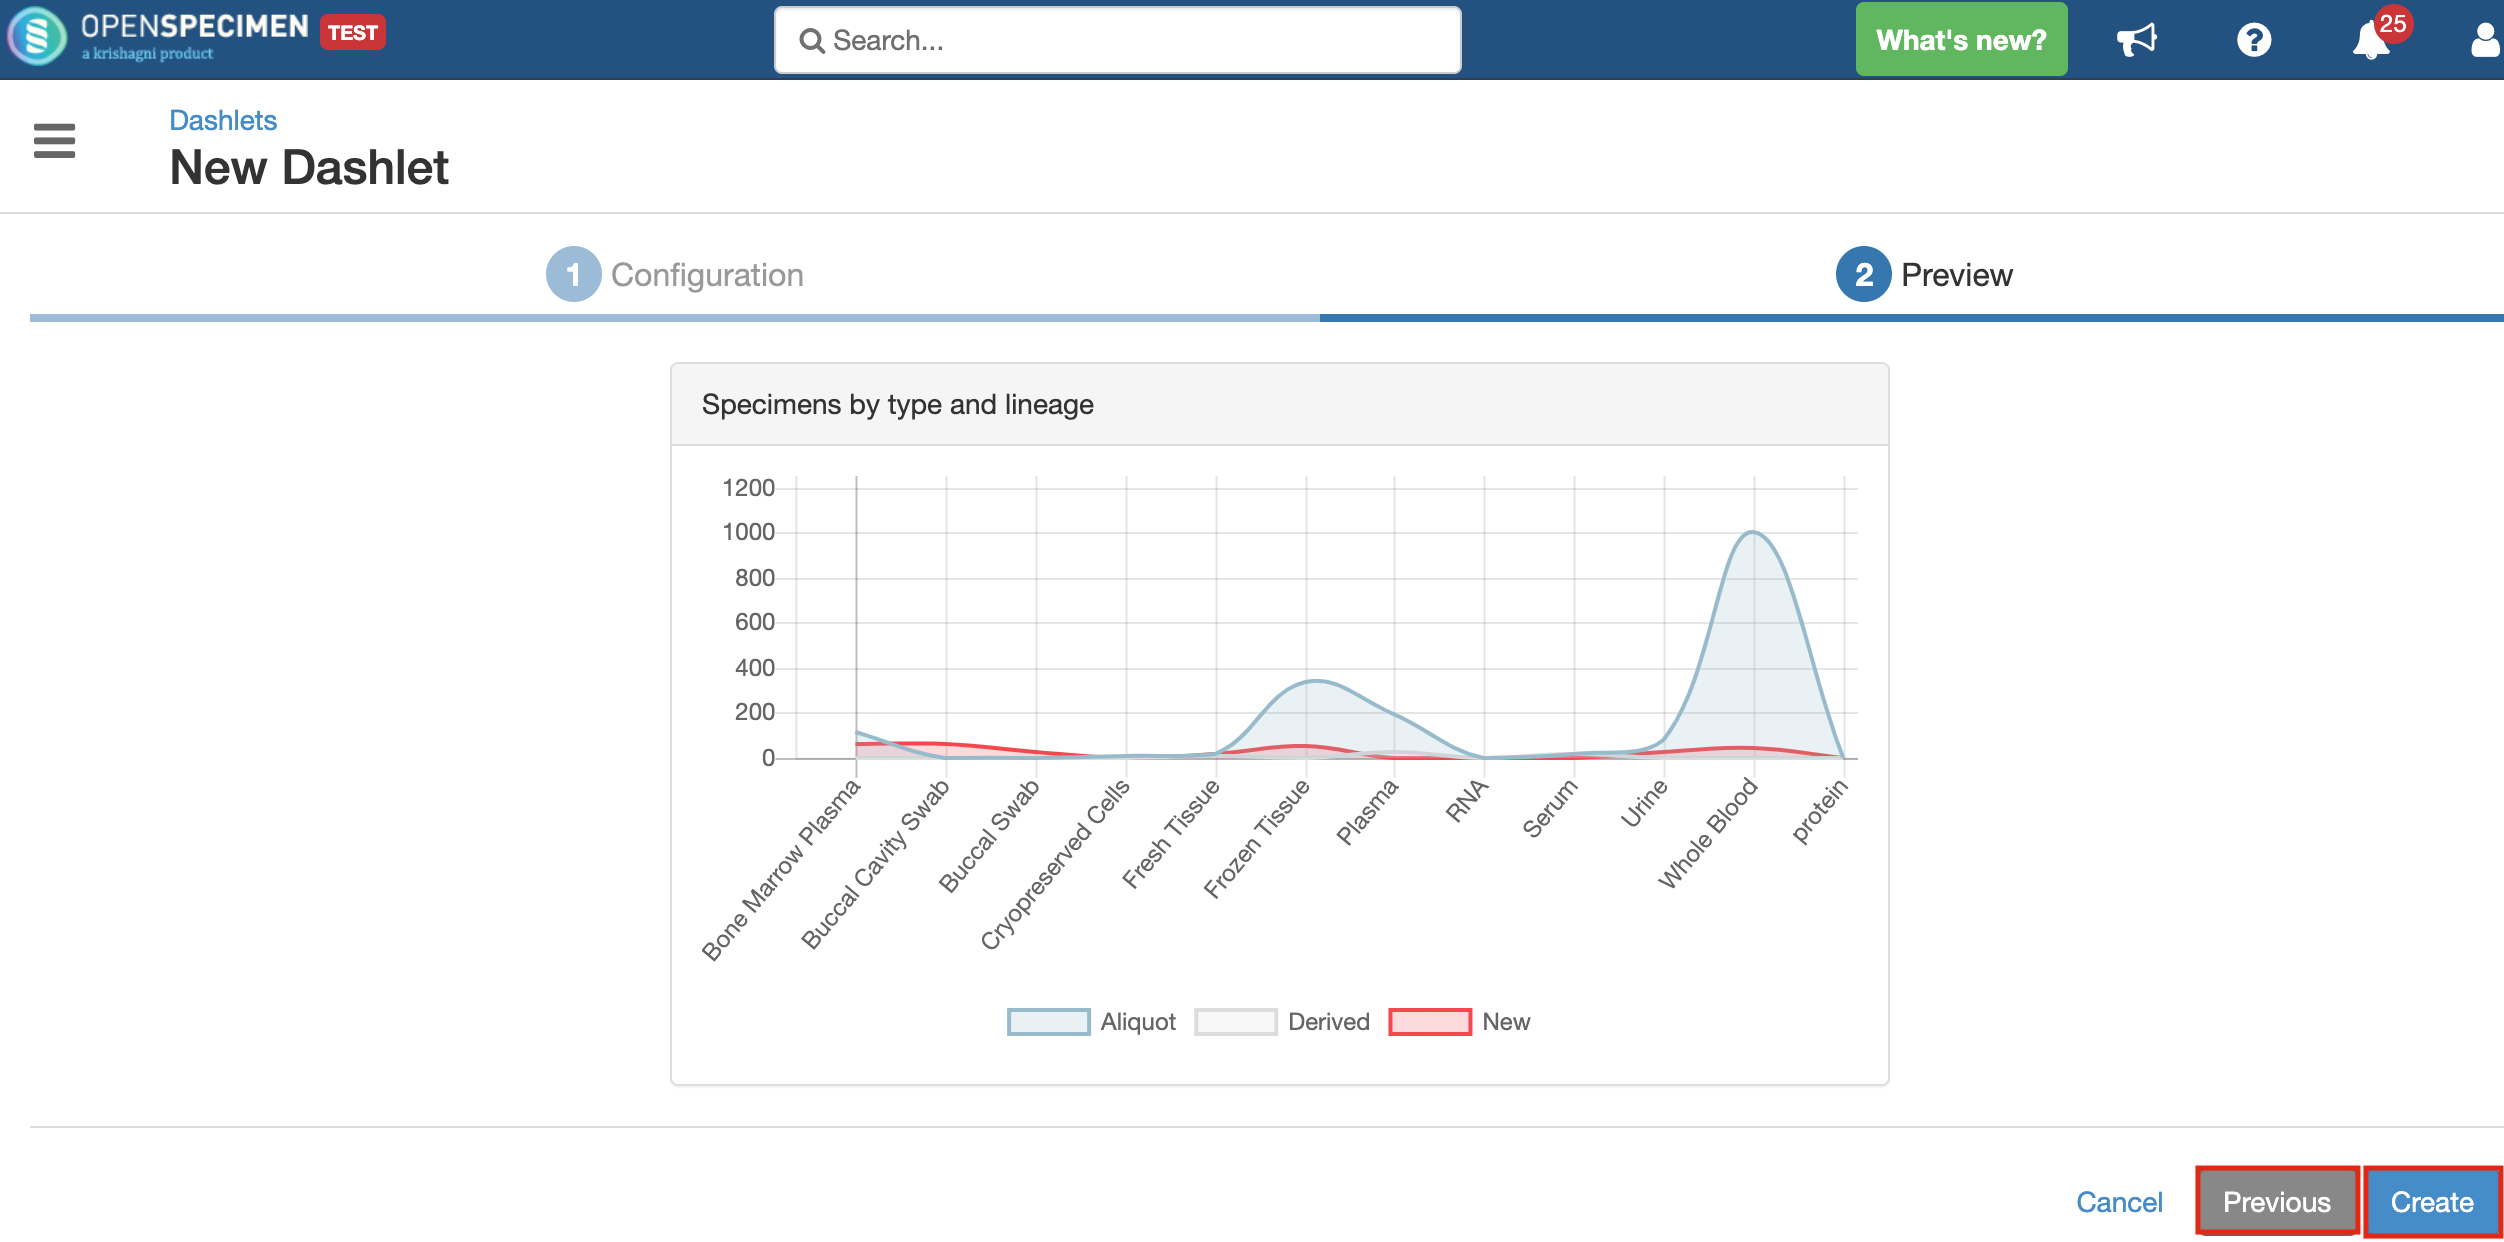
- User can click on 'Previous' if s/he wishes to change the details in the configuration. Click on 'Create' to finally create the dashlet
Setting dashlet for a protocol dashboard
Once the new dashlets are created, it can be set for one or more protocols. If you wish to set the same dashlet for all protocols, it can be done via REST API, refer to Dashboard Configuration.
Steps to set the new dashlet for a specific protocol:
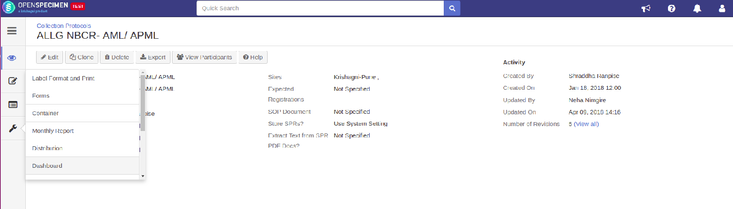
- Edit the protocol by clicking on 'View Details' icon

- Click on 'Settings' icon from the protocol overview page and select 'Dashboard'
- Click on 'Collection Protocol→ Add Dashlet', select the newly created dashlet from the drop-down and click on 'Add'
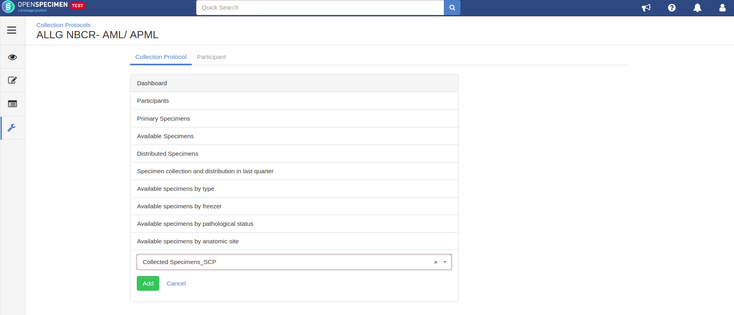
- The newly created metric will appear on the collection protocol dashboard page
Similar steps can be followed to include any new graph dashlets that are created.
Setting dashlet for a participants dashboard
Steps to set the new dashlet for a participants dashboard:
- Click on 'View Details' icon of the CP
- Click on 'Settings' icon and select option 'Dashboard'
- Click on 'Participant', select the newly created dashlet from the drop-down and click on 'Add'
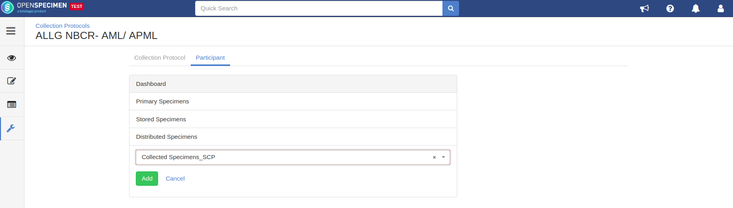
- The newly created metric will appear on the participants dashboard page
You an also view the video for the dashboard configuration here.
Related content
Leave a comment at the end of this page or email contact@krishagni.com