OpenSpecimen allows user to specify aggregate functions like count, sum, average etc. on specific fields and also apply filters on aggregate filters.
Creating aggregate queries
Example 1: Count of registered participants, visits and primary specimens by collection protocols:
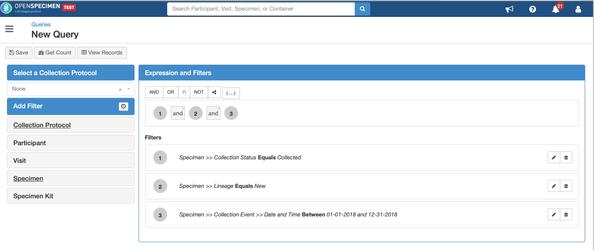
Step1: Create required filters:
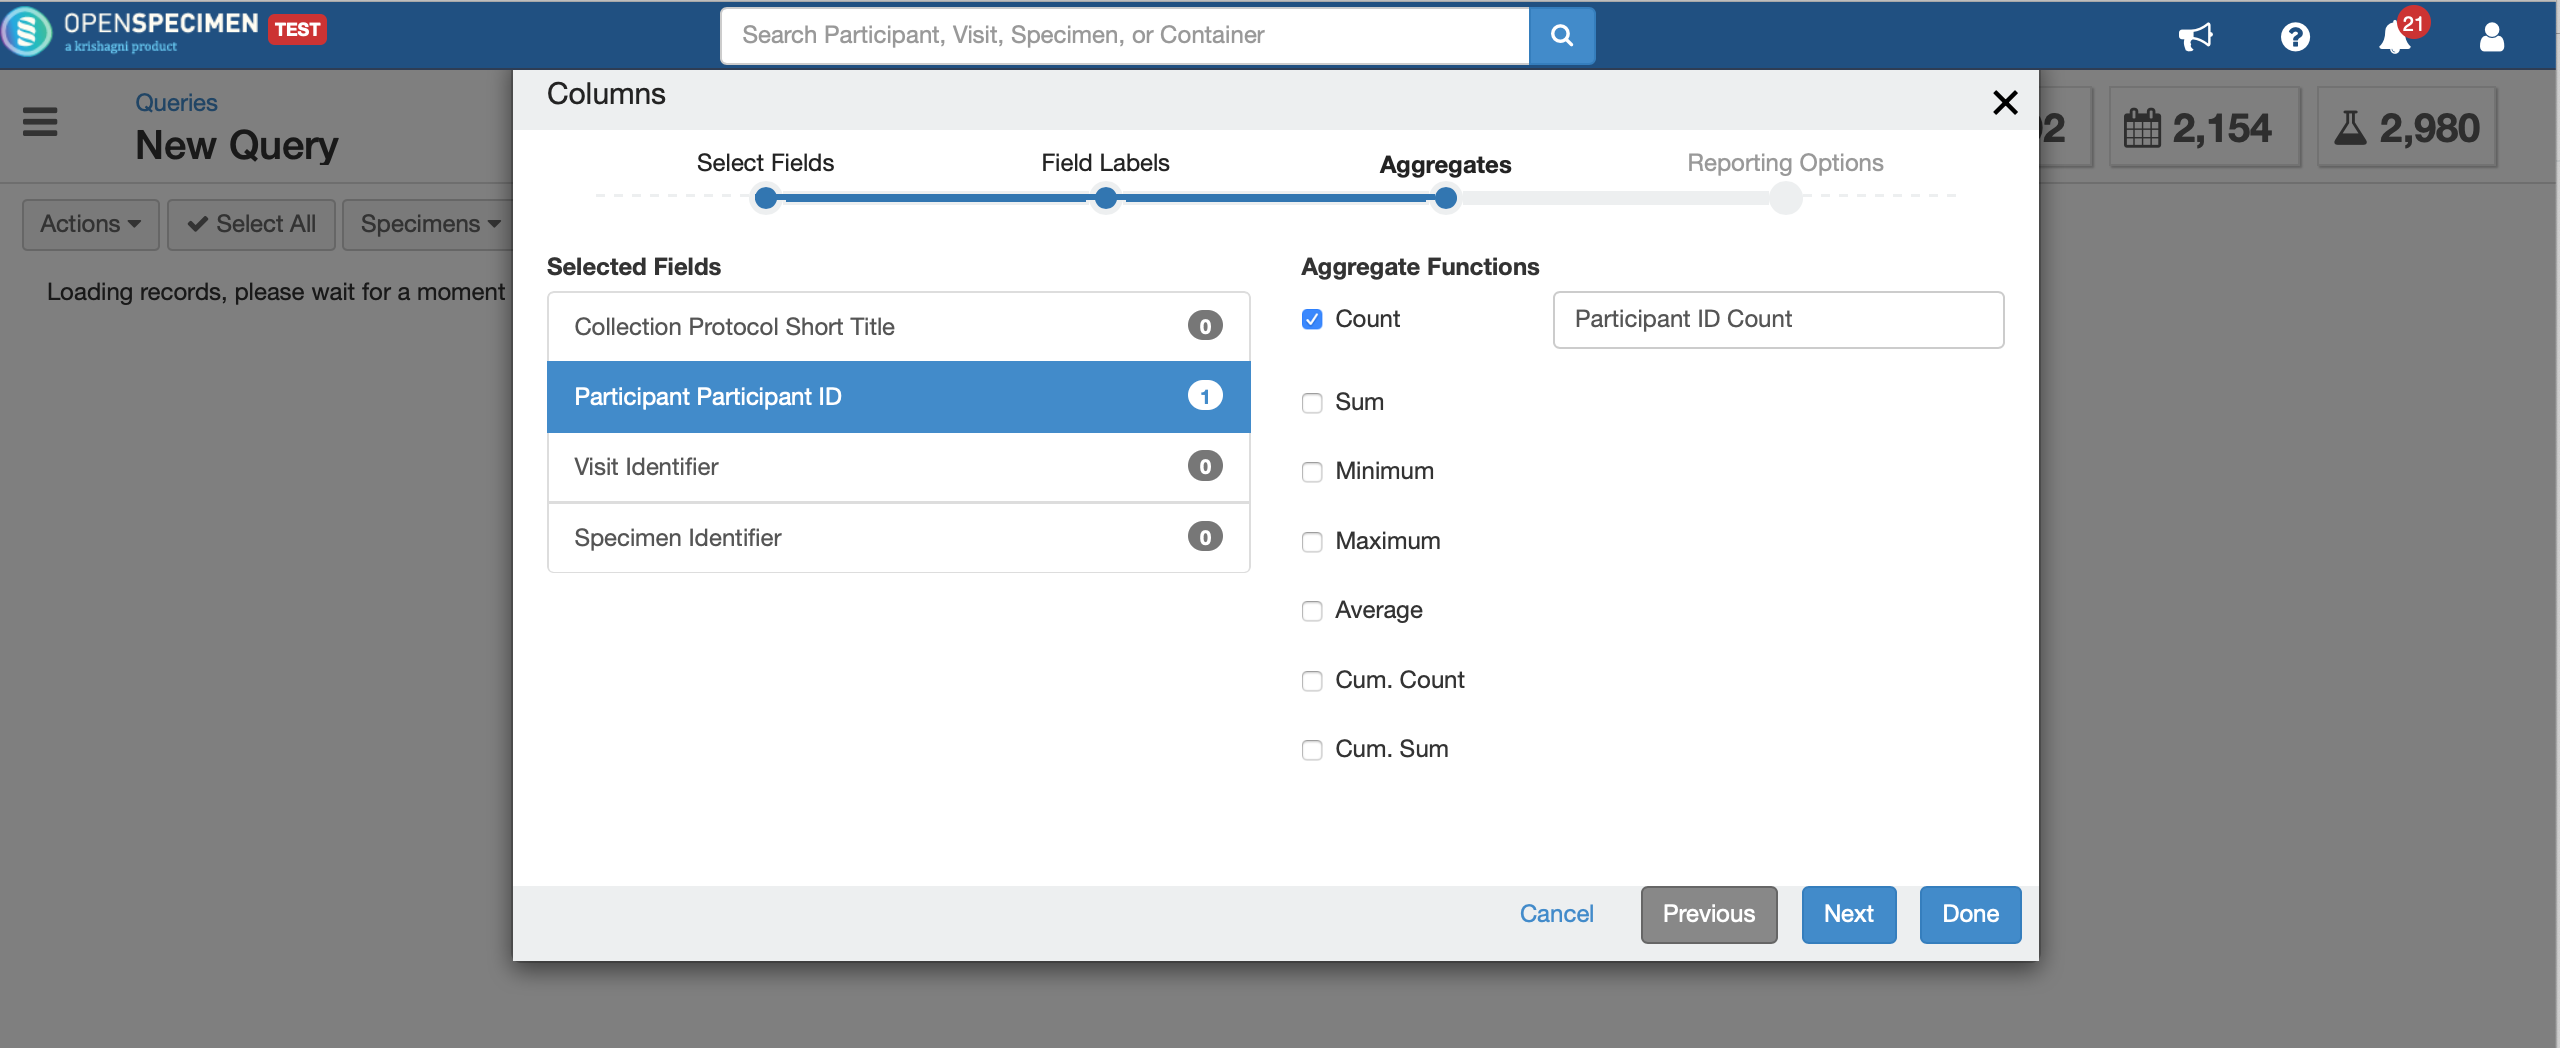
Step 2: Click on 'View Records' and from results view, click on 'Actions→Columns'
Select the columns needed in the report and click on next to go to 'Aggregates' step. Select the appropriate function like 'Count' in this case. The aggregate column can be renamed as needed.
Step 3: Click on 'Done' to see the aggregate results:

Based on the field selected, aggregate functions available differ. For numeric fields functions like sum, avg etc are available but for text fields only count is available.
For pivot table type of summary reports, refer to examples documented in 'Summary reports (Pivot table)'.
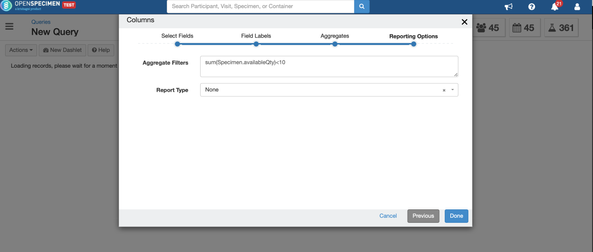
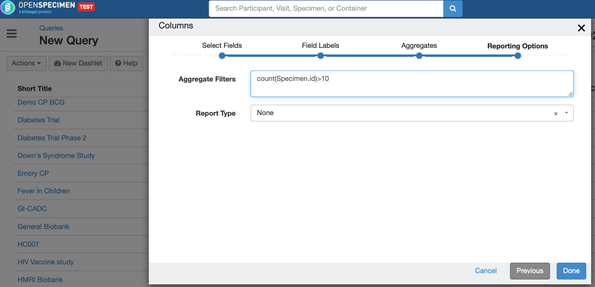
Applying conditions on aggregate values(New in v5.2)
Conditions can also be applied on aggregate functions. This can be done by going to 'Actions→Columns' and going to last step 'Reporting Options'.
- Example 1: Find all participants of participant diagnosis who have more than 10 aliquots available
- Example 2: Find all participants who have less than 10 ml of plasma aliquots stored