| Table of Contents |
|---|
| Info | ||
|---|---|---|
| ||
Dashboards are ONLY available in the Enterprise Edition version. |
Introduction
The dashboard is an enterprise plugin available to display different metrics and graphs per protocol within OpenSpecimen. A default dashboard is installed for every protocol and can be further customized as per local needs.
...
- Go to queries and create the query for the new dashlet. For example, Count of stored aliquots

- Click on 'Actions' and click on 'Columns'. Select the 'Specimen Label' column and click on 'Next'. Select the label field and select 'Count' aggregate function.

- Click on 'Done' and click on 'New Dashlet'


A new dashlet is now created for the count of stored aliquots. This can now be set for the specific protocol to be displayed as part of the protocol. Refer to steps below to set it for a protocol.
...
- Click on 'View Details' icon of the CP
- Click on 'Settings' icon and select option 'Dashboard'
- Click on 'Participant', select the newly created dashlet from the drop-down and click on 'Add'
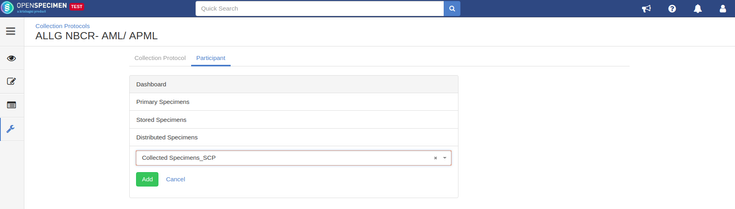
- The newly created metric will appear on the participants dashboard page
You an also view the video for the dashboard configuration here.