Count is well known and is simple to explain. Count function counts number of items/records that satisfy the given criteria.
Cumulative count function is sum of all the counts generated so far. Mathematically it is represented as
Sk = ∑Ci for i = 1 to k
When k = 3, i.e. 3rd cumulative count is calculated by adding up the first 3 counts C1, C2, C3
This might seem very confusing. So let's clear the air with an example:
Consider the following table:
| Date | Count |
|---|---|
| 5 | |
| 7 | |
| 2 | |
| 3 |
| 4 |
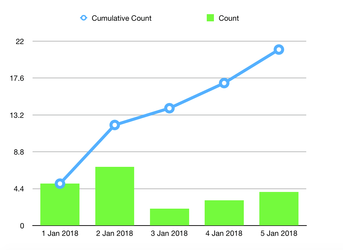
The above table is generated by using simple count of specimens collected every day for first 5 days of the month Jan 2018. However, this table doesn't give an idea of how many specimens were collected in total until a given date. For this purpose, we need to use cumulative count. The 3rd column in below table is generated using cumulative count function.
| Date | Count | Cumulative Count |
|---|---|---|
| 5 | 5 | |
| 7 | 12 | |
| 2 | 14 | |
| 3 | 17 | |
| 4 | 21 |
The difference can be best visualised using below graph.