| Table of Contents | ||||
|---|---|---|---|---|
|
Bulk
...
Operations (v6.1)
The below operations can be performed on users in bulk from the UI:
...
| Expand | ||||||
|---|---|---|---|---|---|---|
| ||||||
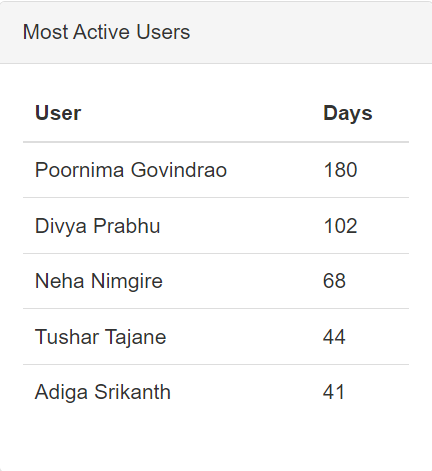
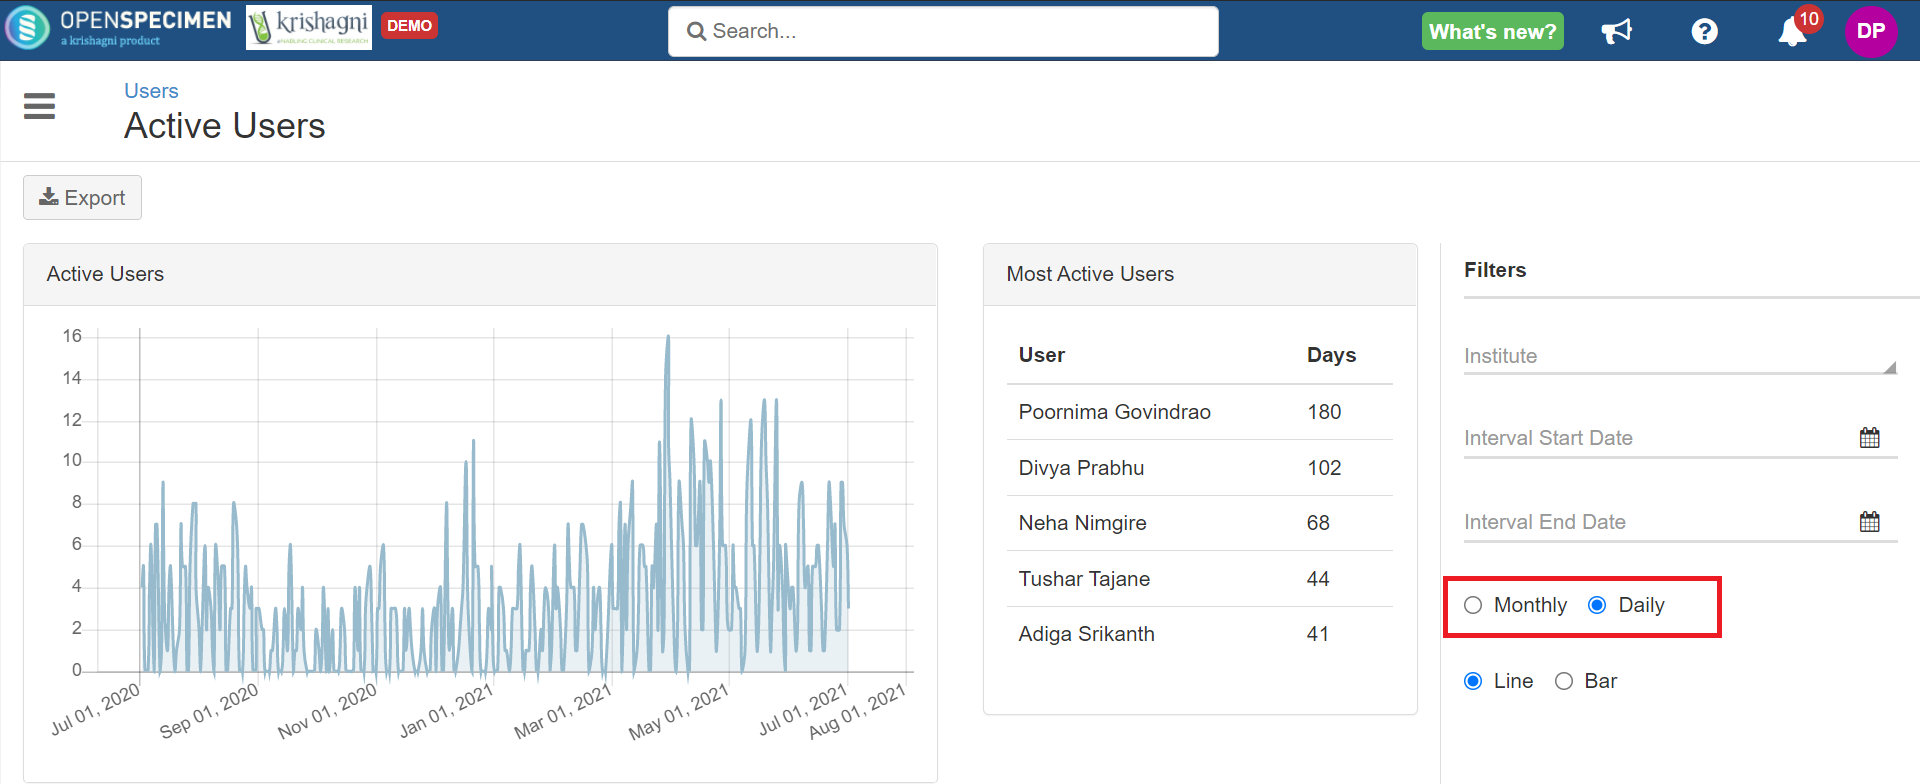
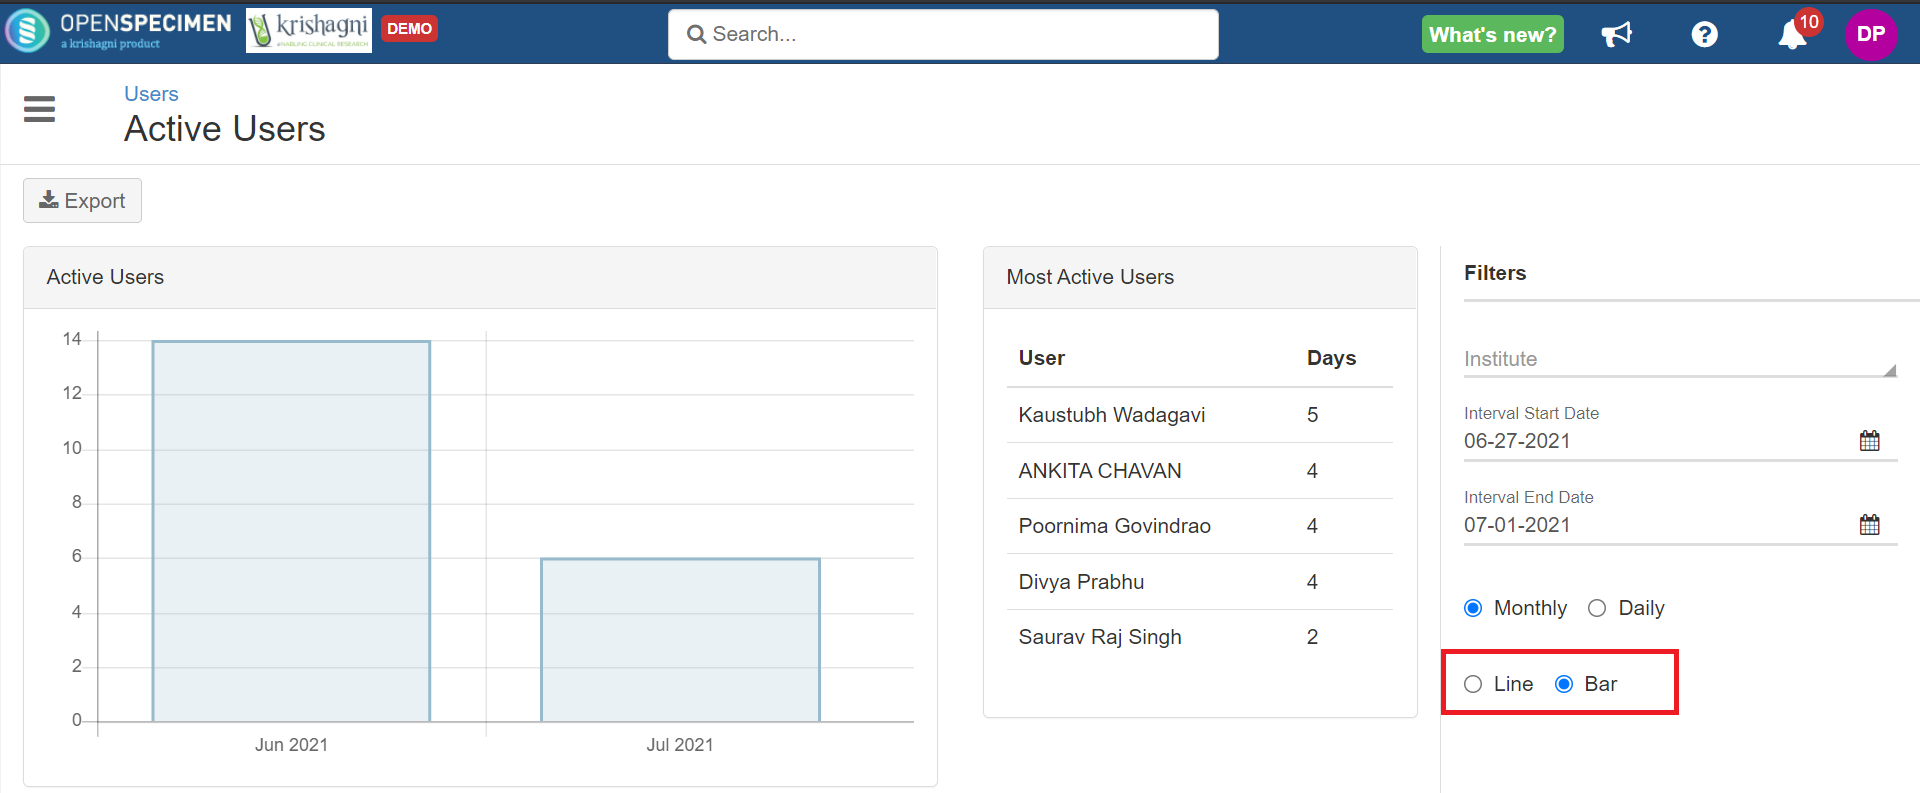
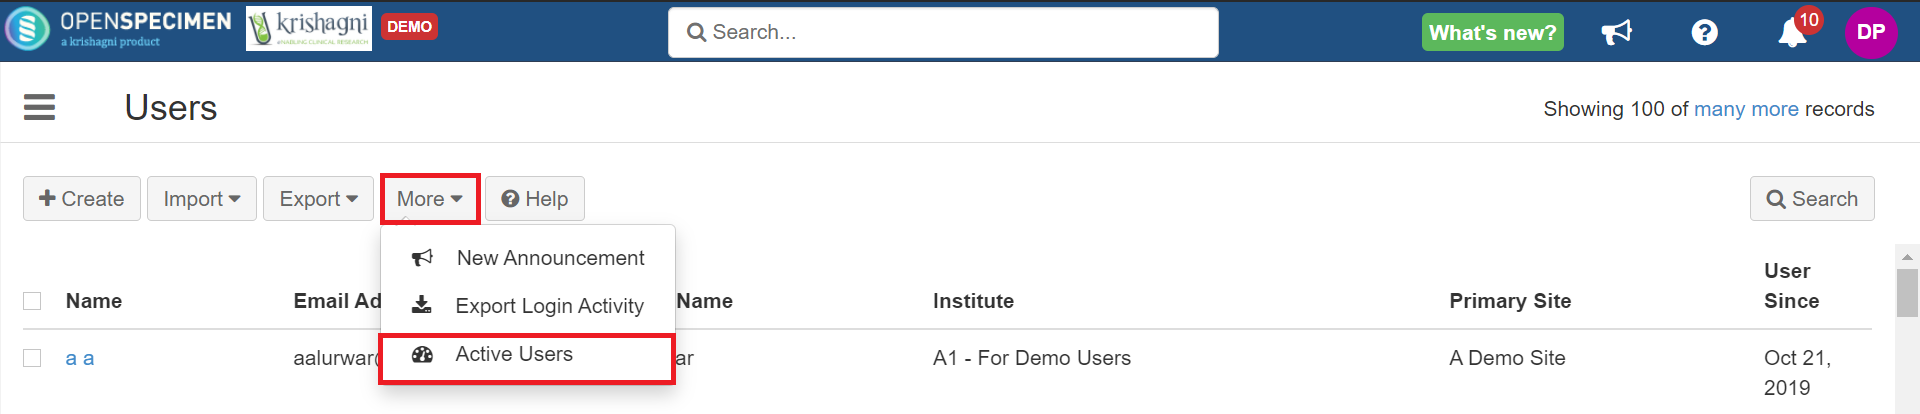 Active Users GraphThe graph would give you a count of users who has logged in at least once in the last 12 months. 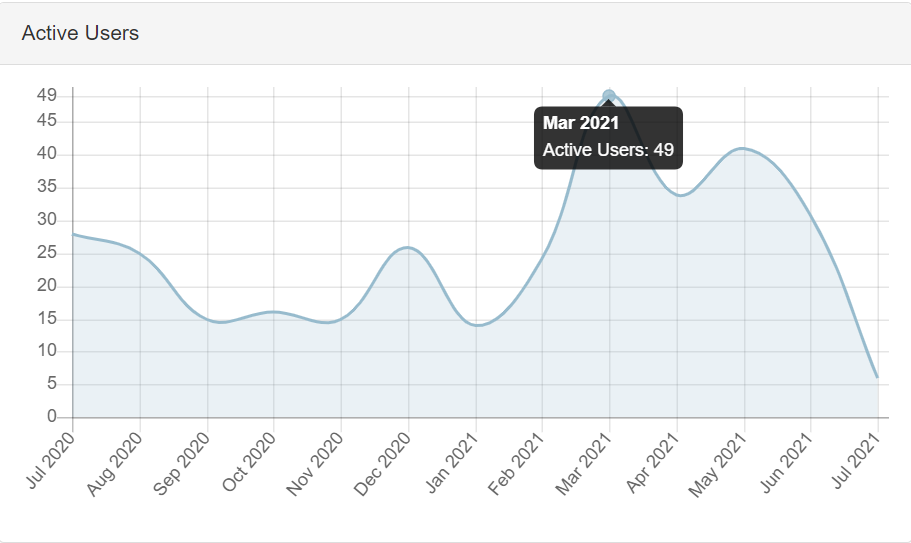 Most Active UsersThis table will show you the “number of days” for which the user has been active in the last 12 months.
 FiltersYou can also view the active users count using the filters:
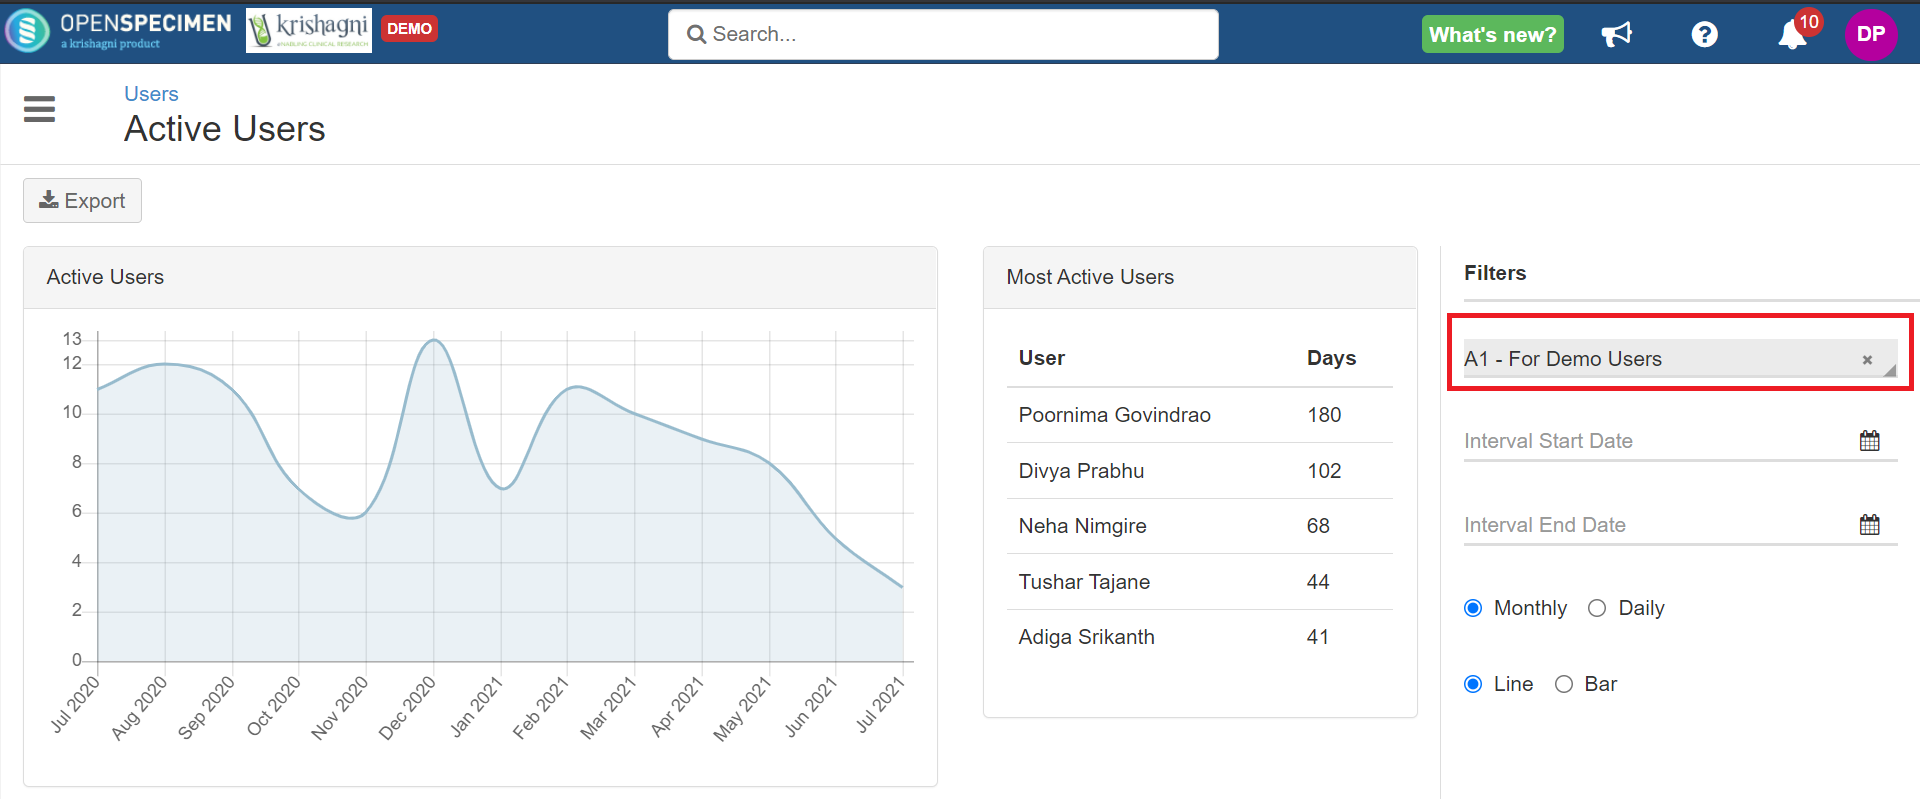
Interval Start Date: The date from when you want to see the count of active users. Interval End Date: The date till when you want to see the count of active users. 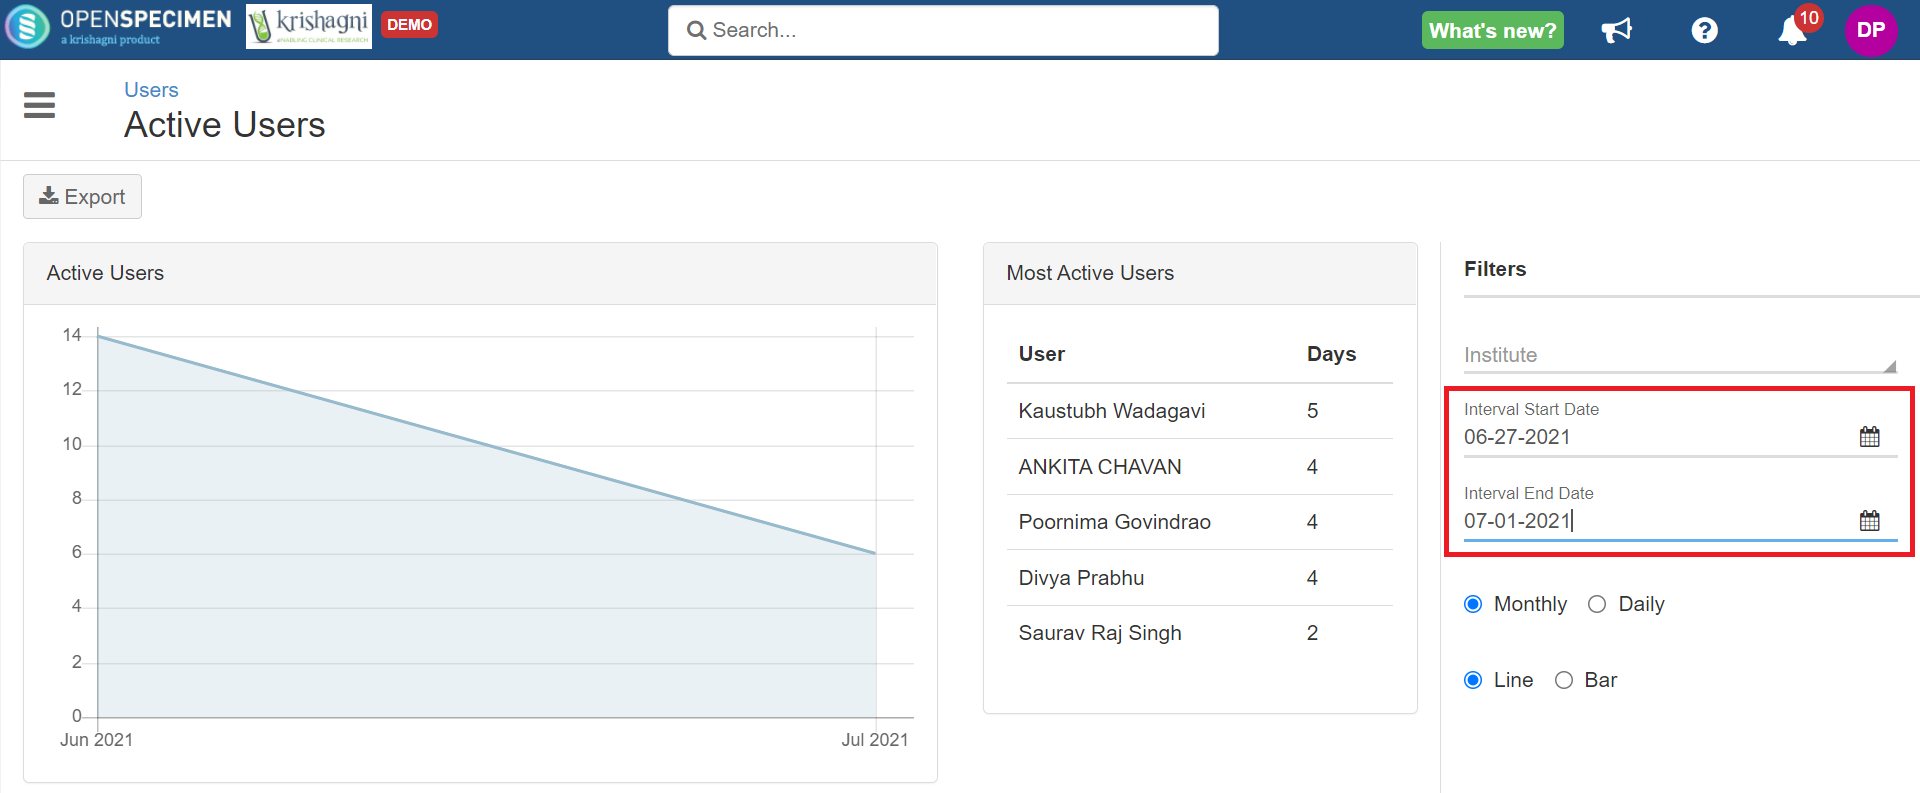
 ExportYou can export the report as a CSV file. The file will contain data like months, active users' count, etc. 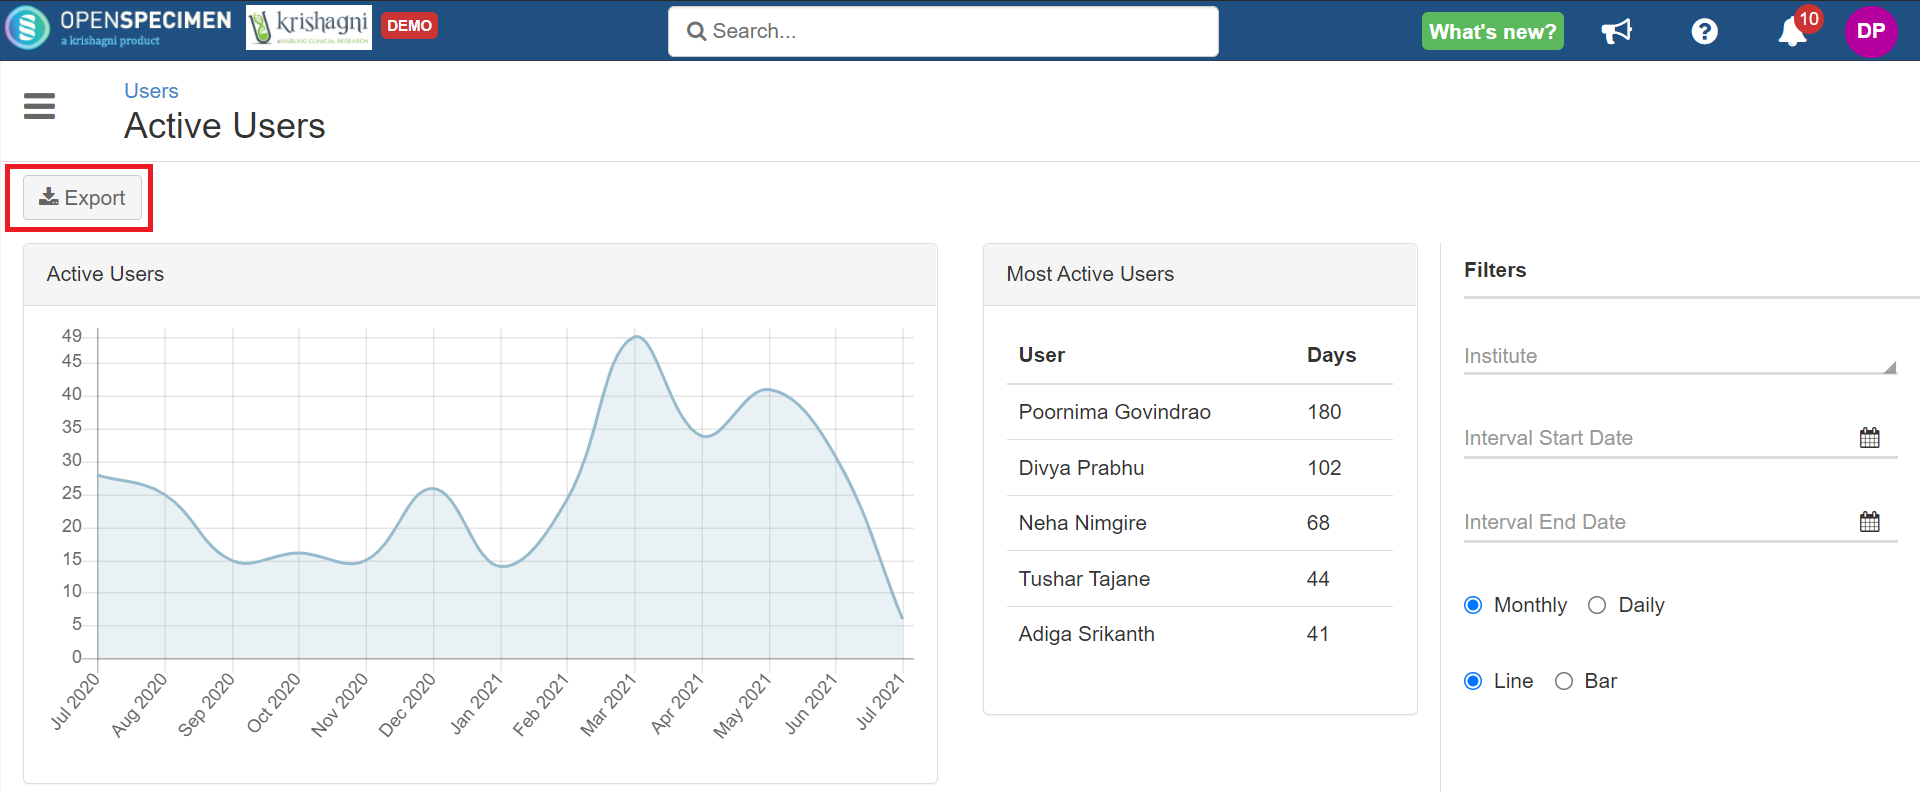  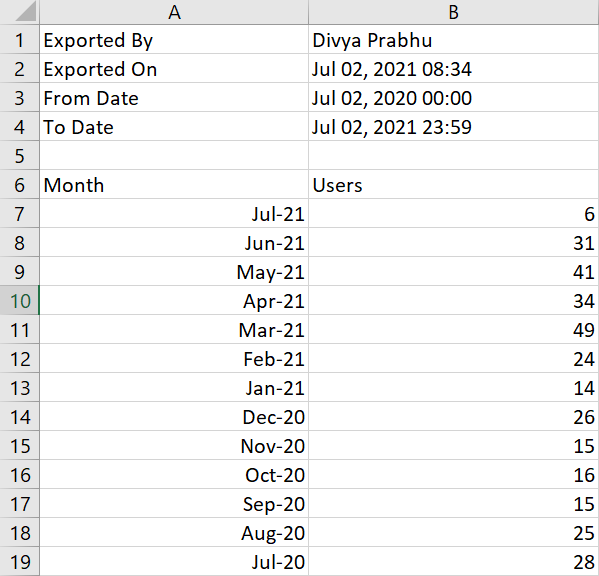 |
Export Login Activity
...