...
Consider the following table:
| Date | Count |
|---|---|
| 5 | |
| 7 | |
| 2 | |
| 3 |
| 4 |
The above table is generated by using simple count of specimens collected every day for first 5 days of the month Jan 2018. However, this table doesn't give an idea of how many specimens were collected in total until a given date. For this purpose, we need to use cumulative count. The 3rd column in below table is generated using cumulative count function.
| Date | Count | Cumulative Count |
|---|---|---|
| 5 | 5 | |
| 7 | 12 | |
| 2 | 14 | |
| 3 | 17 | |
| 4 | 21 |
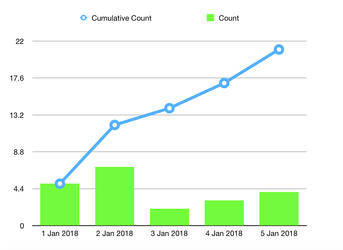
The difference can be best visualised using below graph.